.png?width=69&height=53&name=Acrisure%20Logo%20(White%20Horizontal).png "Acrisure")

July through October is the deadliest period of the year on the road. Summer months result in more cars on the road - and this increase in traffic is dangerous (especially for trucking companies).
As displayed in the graph below, this could not be further from the truth.
Deaths by Month (2010-2015) [1]
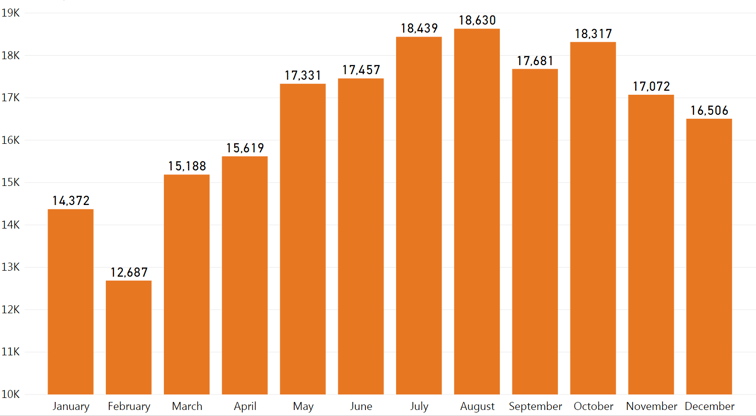
Key insights:
- July, August, September, and October are the 4 deadliest months on the road
- August is the deadliest month of the year. From 2010-2015, 18,630 people have died due to car accidents in August.
- July is the second deadliest month, at 18,439 deaths between 2010 and 2015.
Fatalities per 100M Miles by Month[2]
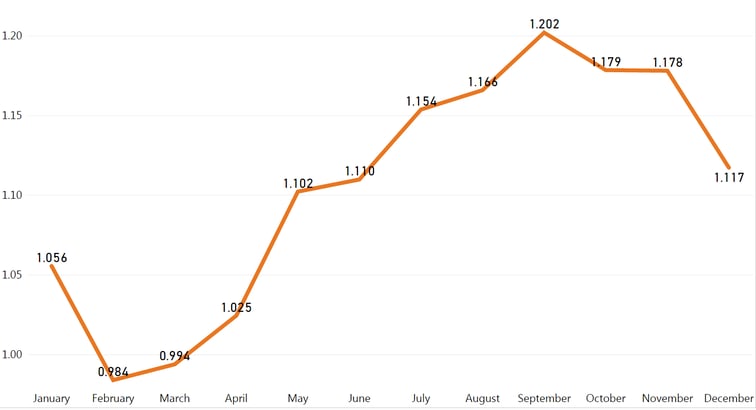
Looking at the rate of fatalities per 100 million miles:
- September is the deadliest month per million miles of driving, at 1.202 deaths
- October and November are the next 2 deadliest months on a per million mile basis
Does this same trend apply to trucking companies?
Frequency & Severity of Trucking Accidents (2010-2015) [3]
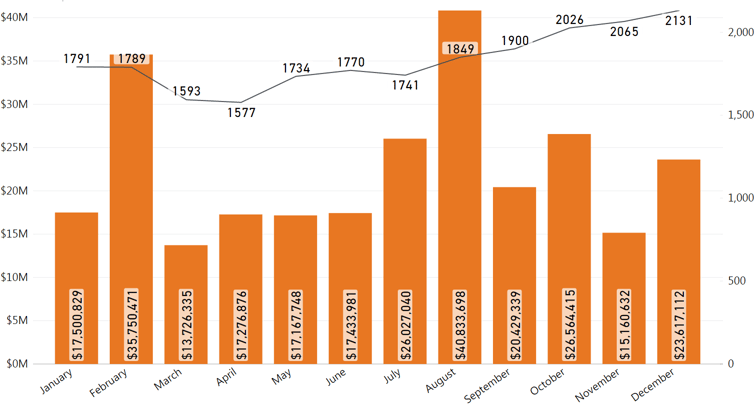
In a study done by HNI of 22,000 accidents between 2010 and 2015:
- August was by far the most severe in terms of incurred losses (14% more than the next highest month)
- July and October were the fourth and third most severe months, respectively
The answer to the question is “Yes”: it appears that this trend affects trucking companies as well. Although July through October are not the four most severe months individually, combined they incur the most of any four-month period.
In regards to frequency, the trend does not follow the same trend. In fact, monthly frequency and monthly severity correlate very little, suggesting that the severity of accidents differs from month to month. Larger accidents skew data, and the data suggests that these larger accidents are more prevalent in months such as August.
The Impact of Large Accidents
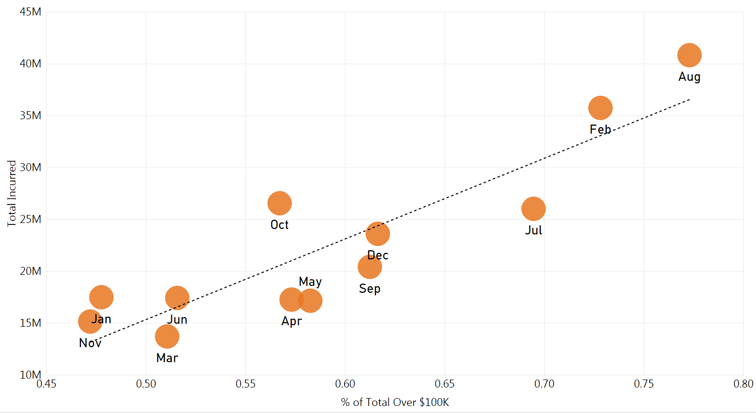
This graph shows that there is a strong correlation between how much a month incurs and how much of that incurred is from large accidents (defined as over $100K).
In these high danger months frequency is not the issue, but rather increased frequency of large accidents.
What action can you take to de-risk?
- Do a historical analysis on your company’s performance in the months of July through October. Identify any trends in accident types or locations that can be addressed.
- Set goals to beat past years' performance and reward the company if these goals are reached.
- Train drivers in the areas that need improvement
- Contact HNI if you need help with any of the above.
Order your free banner to celebrate Truck Driver Appreciation Week:
